Multiple Choice

Figure 11.2
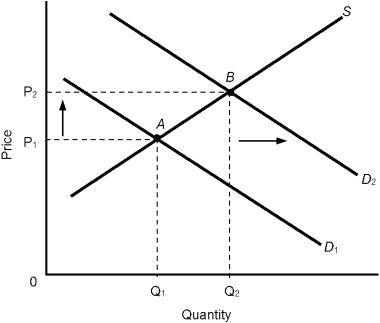
-In Figure 11.2, the increase in equilibrium prices could represent
A) cost-push inflation.
B) wage-push inflation.
C) demand-pull inflation.
D) decreased supply.
E) decreased demand.
Correct Answer:
Verified
Related Questions
Q76: When inflation is much higher than expected,
Q84: If you borrow $1,000 on credit cards
Q85: Which of the following could contribute to
Q87: When the real interest rate is less
Q88: A variable-rate mortgage
A) eliminates the risk of
Q90: Expected inflation
A) increases the efficiency of the
Unlock this Answer For Free Now!
View this answer and more for free by performing one of the following actions

Scan the QR code to install the App and get 2 free unlocks

Unlock quizzes for free by uploading documents