Multiple Choice
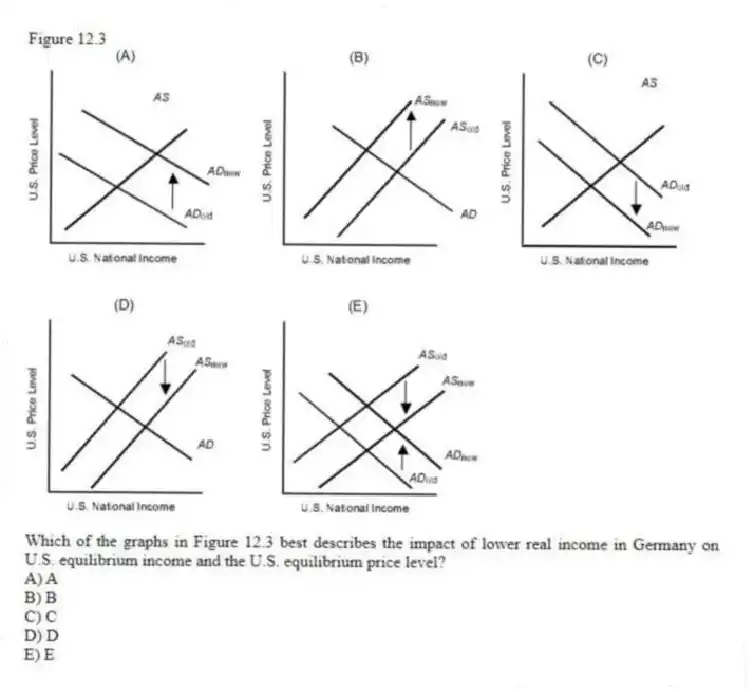
Figure 12.3
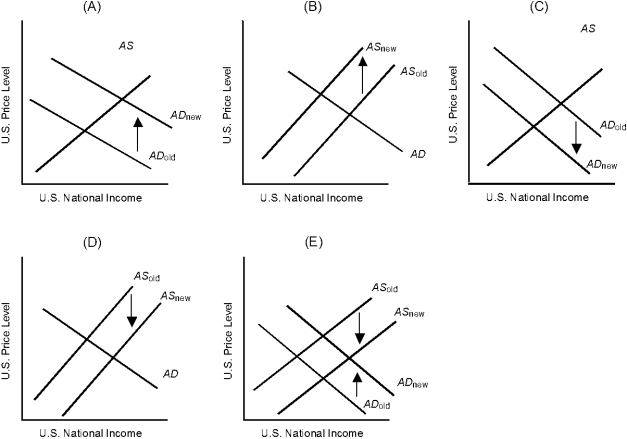
-Which of the graphs in Figure 12.3 best describes the impact of lower real income in Germany on U.S. equilibrium income and the U.S. equilibrium price level?
A) A
B) B
C) C
D) D
E) E
Correct Answer:
Verified
Related Questions
Q74: A simultaneous increase in both unemployment and
Q75: Figure 12.3 Q76: A decline in short-run aggregate supply would Q77: Figure 12.2 Q78: Figure 12.2 Q80: If both aggregate demand and short-run aggregate Q81: Government spending is set by the federal Unlock this Answer For Free Now! View this answer and more for free by performing one of the following actions Scan the QR code to install the App and get 2 free unlocks Unlock quizzes for free by uploading documents
![]()
![]()
![]()

