Multiple Choice
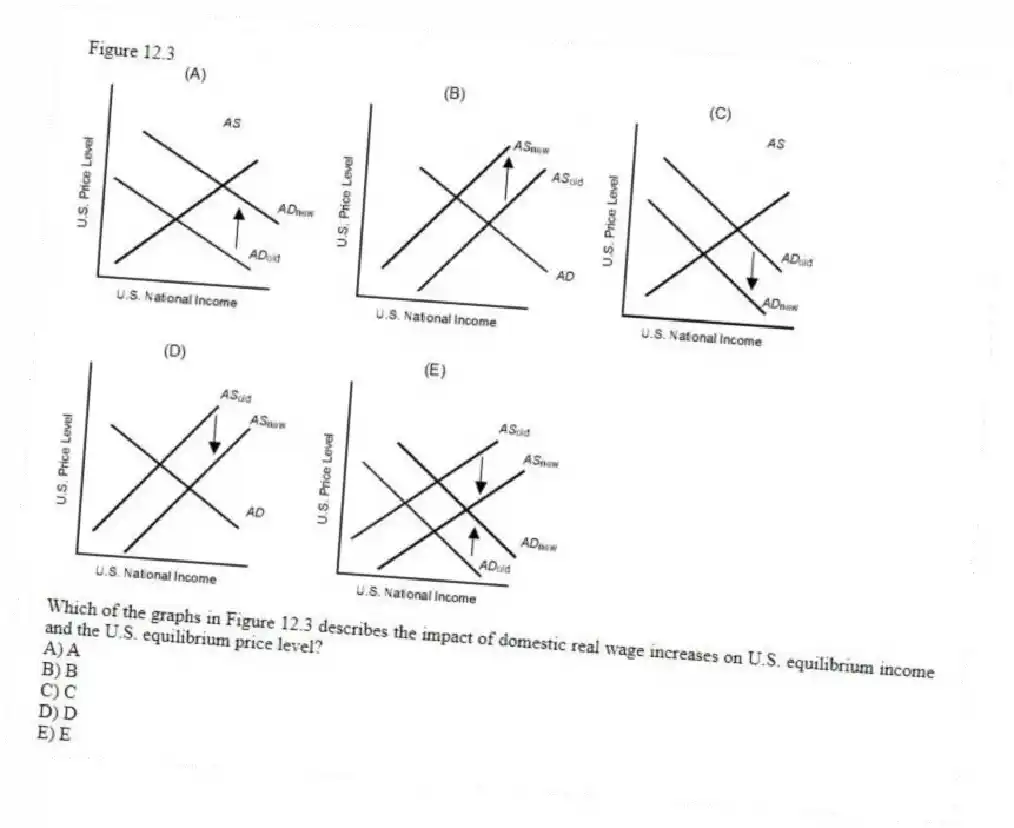
Figure 12.3
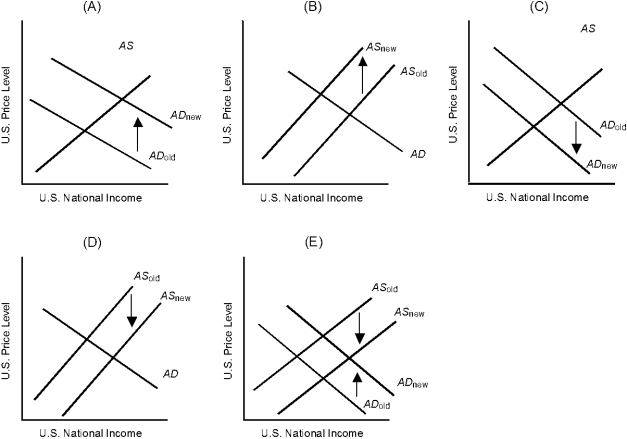
-Which of the graphs in Figure 12.3 describes the impact of domestic real wage increases on U.S. equilibrium income and the U.S. equilibrium price level?
A) A
B) B
C) C
D) D
E) E
Correct Answer:
Verified
Related Questions

