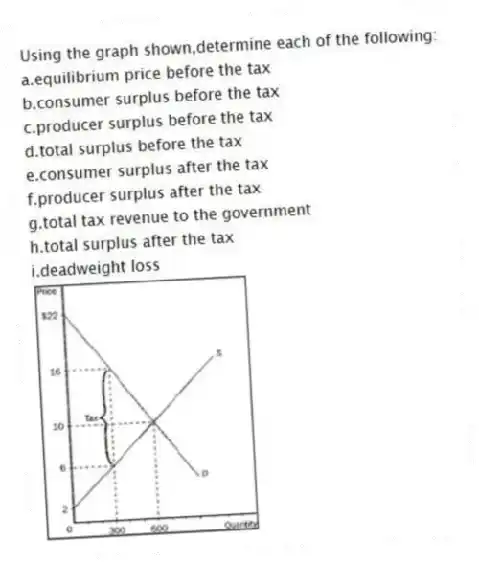
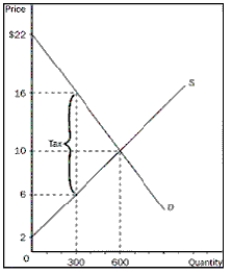
Using the graph shown,determine each of the following:
a.equilibrium price before the tax
b.consumer surplus before the tax
c.producer surplus before the tax
d.total surplus before the tax
e.consumer surplus after the tax
f.producer surplus after the tax
g.total tax revenue to the government
h.total surplus after the tax
i.deadweight loss
Correct Answer:
Verified
b. $3600
c. $...
View Answer
Unlock this answer now
Get Access to more Verified Answers free of charge
Q20: A tax raises the price received by
Q196: If a tax did not induce buyers
Q198: Which statement best summarizes the idea of
Q199: Normally,both buyers and sellers are worse off
Q200: If the supply curve is more elastic,all
Q202: Consider a (per unit) tax on two
Q203: Because the supply of land is perfectly
Q204: If the size of a tax doubles,the
Q205: Illustrate on three demand and supply graphs
Q206: Use the following graph shown to fill
Unlock this Answer For Free Now!
View this answer and more for free by performing one of the following actions

Scan the QR code to install the App and get 2 free unlocks

Unlock quizzes for free by uploading documents