Essay
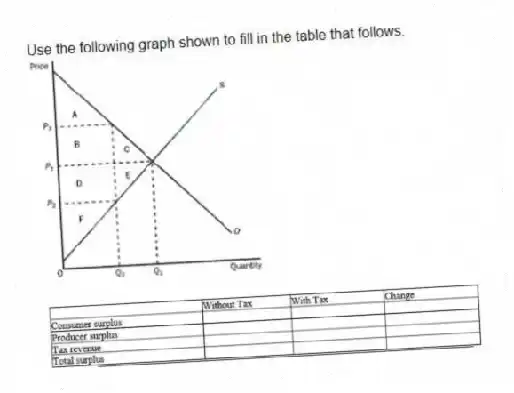
Use the following graph shown to fill in the table that follows.
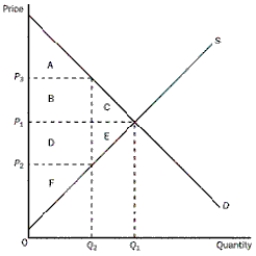
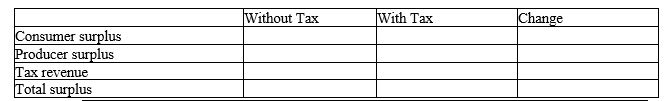
Correct Answer:
Verified
Related Questions
Q45: The deadweight loss of a tax rises
Q54: Economist Arthur Laffer made the argument that
Q118: John has been in the habit of
Q201: Using the graph shown,determine each of the
Q202: Consider a (per unit) tax on two
Q203: Because the supply of land is perfectly
Q204: If the size of a tax doubles,the
Q205: Illustrate on three demand and supply graphs
Q207: The most important tax in the Canadian
Q209: Consider the following two statements:
1) “A
Unlock this Answer For Free Now!
View this answer and more for free by performing one of the following actions

Scan the QR code to install the App and get 2 free unlocks

Unlock quizzes for free by uploading documents