Figure 11-3
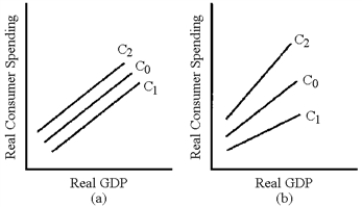
-In Figure 11-3, which line represents the change in the consumption schedule caused by a cut in fixed taxes?
A) C₁ in graph (a)
B) C2 in graph (a)
C) C₁ in graph (b)
D) C2 in graph (b)
Correct Answer:
Verified
Q185: Table 11-1 Q191: In the short run, tax cuts that Q192: Which of the following factors has the Q193: Figure 11-3 Q195: Explain why a change in income tax Q197: A Keynesian economist would expect a supply-side Q197: Government can raise GDP by $1,000 billion Q198: Define the following terms and explain their Q199: Most economists seem to agree that cutting Q206: Explain how a "conservative" and a "liberal"![]()
![]()
Unlock this Answer For Free Now!
View this answer and more for free by performing one of the following actions

Scan the QR code to install the App and get 2 free unlocks

Unlock quizzes for free by uploading documents