Multiple Choice
Figure 11-3
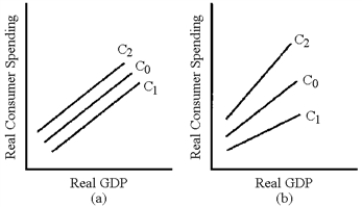
-In Figure 11-3, which line represents the change in the consumption schedule caused by an increase in the personal income tax?
A) C₁ in graph (a)
B) C2 in graph (a)
C) C₁ in graph (b)
D) C2 in graph (b)
Correct Answer:
Verified
Related Questions
Q182: As a general rule, when an income
Q185: Table 11-1 Q189: The Reagan tax cuts of the 1980s Q191: In the short run, tax cuts that Q192: Which of the following factors has the![]()
A)had
Unlock this Answer For Free Now!
View this answer and more for free by performing one of the following actions

Scan the QR code to install the App and get 2 free unlocks

Unlock quizzes for free by uploading documents