
Figure 5-5
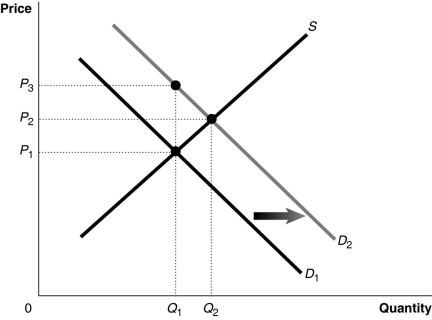
Figure 5-5 shows a market with an externality. The current market equilibrium output of Q₁ is not the economically efficient output. The economically efficient output is Q₂.
-Refer to Figure 5-5.Suppose the current market equilibrium output of Q₁ is not the economically efficient output because of an externality.The economically efficient output is Q₂.In that case, diagram shows
A) the effect of a subsidy granted to producers of a good.
B) the effect of an excess demand in a market.
C) the effect of a positive externality in the consumption of a good.
D) the effect of a negative externality in the consumption of a good.
Correct Answer:
Verified
Q68: Article Summary
According to the online real estate
Q69: The marginal private cost of a good
Q70: When products that create positive externalities are
Q71: When there is a positive externality in
Q72: Figure 5-4 Q74: The marginal social cost of a good Q75: When there is a negative externality, the Unlock this Answer For Free Now! View this answer and more for free by performing one of the following actions Scan the QR code to install the App and get 2 free unlocks Unlock quizzes for free by uploading documents
![]()

