Use the figure below to answer the following question.
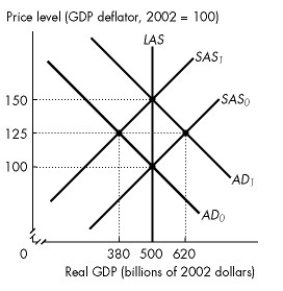
Figure 28.1.1
-Refer to Figure 28.1.1.The figure illustrates an economy initially in equilibrium at the intersection of the SAS0 curve and the AD0 curve.Which of the following shifts the short-run aggregate supply curve from SAS0 to SAS1?
A) an increase in the price of oil
B) an increase in the price level
C) an increase in the marginal product of labour
D) an increase in the demand for money
E) a decrease in the money wage rate
Correct Answer:
Verified
Q9: Inflation resulting from an increase in aggregate
Q13: Stagflation occurs when the economy experiences both
A)rising
Q16: Use the figure below to answer the
Q17: Use the figure below to answer the
Q21: Suppose aggregate demand increases by more than
Q23: Use the figure below to answer the
Q28: The economy starts out at a full-employment
Q48: An increase in the price level due
Q54: A cost-price inflation spiral results if the
Q79: A correctly anticipated increase in the quantity
Unlock this Answer For Free Now!
View this answer and more for free by performing one of the following actions

Scan the QR code to install the App and get 2 free unlocks

Unlock quizzes for free by uploading documents