Use the figure below to answer the following questions.
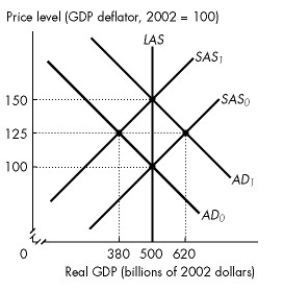
Figure 28.1.3
-Refer to Figure 28.1.3.Assume that the figure illustrates an economy initially in equilibrium at the intersection of the SAS0 curve and the AD0 curve.If the aggregate demand curve is expected to remain at AD0 but shifts to AD1,the new equilibrium real GDP is ________ and the new equilibrium price level is ________.
A) $380 billion; 125
B) $500 billion; 150
C) $500 billion; 100
D) $620 billion; 125
E) $500 billion; 125
Correct Answer:
Verified
Q19: Use the figure below to answer the
Q21: Suppose aggregate demand increases by more than
Q28: The economy starts out at a full-employment
Q30: Use the figure below to answer the
Q34: Use the figure below to answer the
Q39: Use the figure below to answer the
Q47: An economy is in long-run equilibrium when
Q48: An increase in the price level due
Q54: A cost-price inflation spiral results if the
Q79: A correctly anticipated increase in the quantity
Unlock this Answer For Free Now!
View this answer and more for free by performing one of the following actions

Scan the QR code to install the App and get 2 free unlocks

Unlock quizzes for free by uploading documents