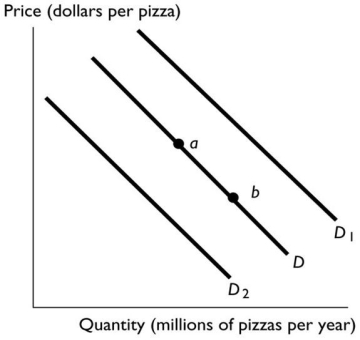
-In the above figure,the shift in the demand curve from D to D₁ can be the result of
A) an increase in the price of cola,a complement to pizza.
B) an increase in the number of teenagers,all of whom demand more pizza than other age groups.
C) a decrease in income if pizza is a normal good.
D) new technology that increases the profit from producing pizza.
E) a decrease in the price of a hamburger,a substitute for pizza.
Correct Answer:
Verified
Q38: Q39: A huge 50 per cent off sale Q40: Lesley buys 6 cappuccinos per week when Q41: If the number of companies producing memory Q43: Q44: Q44: A decrease in the price of a Q45: It is expected that the price of Q46: Which of the following increases the quantity Q47: Unlock this Answer For Free Now! View this answer and more for free by performing one of the following actions Scan the QR code to install the App and get 2 free unlocks Unlock quizzes for free by uploading documents![]()
![]()
![]()
![]()

