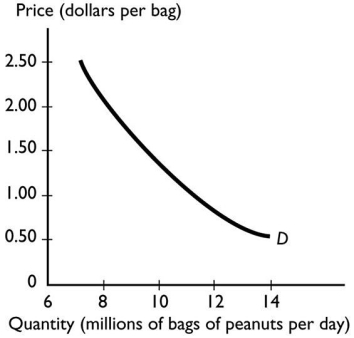
The graph sbove illustrates the demand for peanuts.Peanuts are a normal good because the
A) demand for peanuts increases when the price of one of its substitutes rises.
B) peanuts have both substitutes and complements.
C) demand curve for peanuts slopes downward.
D) demand for peanuts increases when income increases.
E) demand curve shows that if the price of peanuts rises,there is a movement along the demand curve to a lower quantity demanded.
Correct Answer:
Verified
Q38: Q39: A huge 50 per cent off sale Q40: Lesley buys 6 cappuccinos per week when Q41: If the number of companies producing memory Q42: Q44: A decrease in the price of a Q45: It is expected that the price of Q46: Which of the following increases the quantity Unlock this Answer For Free Now! View this answer and more for free by performing one of the following actions Scan the QR code to install the App and get 2 free unlocks Unlock quizzes for free by uploading documents![]()
![]()

