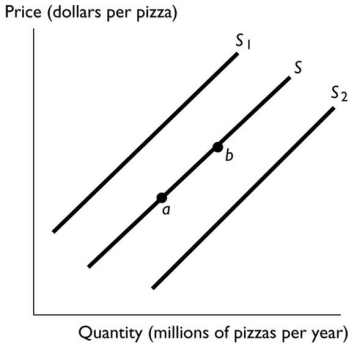
-In the above figure,the movement from point a to point b reflects
A) an increase in the price of pizza.
B) a decrease in the cost of the tomato sauce used to produce pizza.
C) an increase in the supply of pizza.
D) a decrease in income if pizza is a normal good.
E) an increase in the number of producers of pizza.
Correct Answer:
Verified
Q75: Q76: Q77: Which of the following increases the supply Q78: An increase in the productivity of producing Q79: Q81: Computer chips are a normal good.Suppose the Q82: When there is a surplus of snowboards,the Q83: When the demand curve shifts rightward and Q84: Q85: Unlock this Answer For Free Now! View this answer and more for free by performing one of the following actions Scan the QR code to install the App and get 2 free unlocks Unlock quizzes for free by uploading documents![]()
![]()
![]()
A)supply![]()
![]()

