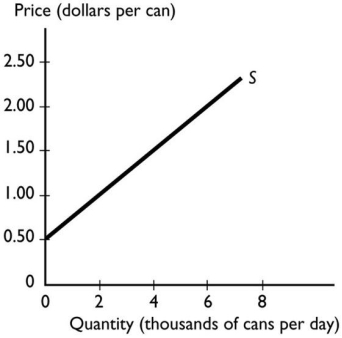
The graph above illustrates the supply of cola.If the price of cola rises from $0.50 a can to $1.50 a can,the quantity of cola supplied
A) increases from 0 to 6,000 cans a day.
B) decreases from 4,000 cans to 0 cans a day.
C) increases from 0 cans to 4,000 cans a day.
D) remains unchanged because the supply increases not the quantity supplied.
E) remains unchanged because the supply decreases not the quantity supplied.
Correct Answer:
Verified
Q70: Q71: Advances in productivity increase supply because they Q72: If a higher price for wheat decreases Q73: The quantity supplied of a good,service or Q74: Q76: Q77: Which of the following increases the supply Q78: An increase in the productivity of producing Q79: Q80: Unlock this Answer For Free Now! View this answer and more for free by performing one of the following actions Scan the QR code to install the App and get 2 free unlocks Unlock quizzes for free by uploading documents![]()
![]()
![]()
![]()
![]()

