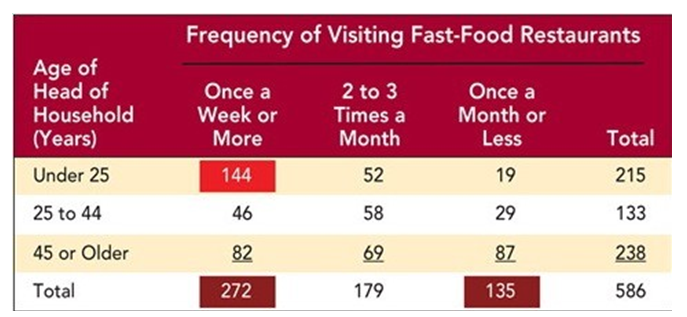
Figure 8-6A
-Consider Figure 8-6A above.Suppose you are an owner of a local Wendy's restaurant near a large urban college or university.You hired a marketing research firm to conduct a survey among a sample of respondents in your area to find out their patronage of fast-food restaurants.Four weeks after the firm conducted the survey,it presented the following results to you.What does this figure represent?
A) a trend extrapolation
B) a Likert scale report
C) a perceptual map
D) a cross tabulation
E) a marketing input report
Correct Answer:
Verified
Q223: The extraction of hidden predictive information from
Q229: All of the following are true about
Q240: A cross tabulation refers to
A) the selection
Q246: Marketing teams must be vigilant in looking
Q251: The two aspects of the process for
Unlock this Answer For Free Now!
View this answer and more for free by performing one of the following actions

Scan the QR code to install the App and get 2 free unlocks

Unlock quizzes for free by uploading documents