Figure 13-4B
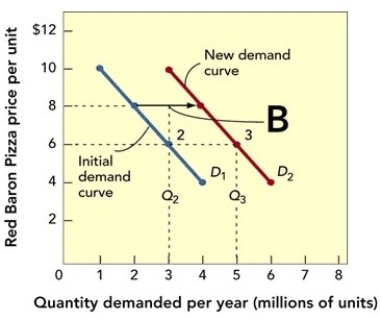
-In Figure 13-4B above,the demand curve shifts from D₂ to D₃ (B) .This most likely represents
A) an increase in demand resulting from competitor or consumer changes.
B) an increase in demand that required a decrease in price.
C) no change in price and no change in demand.
D) no change in demand or price but a greater profit due to economies of scale.
E) a decrease in price from $8 to $6 per unit.
Correct Answer:
Verified
Q106: If competitive market circumstances are such that
Q125: All of the following are demand factors
Q126: The horizontal axis of a demand curve
Q128: Factors that determine consumers' willingness and ability
Q135: A demand curve is a graph that
Q138: Figure 13-3 Q141: Which of the following statements about the Q143: Figure 13-4B Q146: Price elasticity of demand (E)is expressed as Q147: Figure 13-4B Unlock this Answer For Free Now! View this answer and more for free by performing one of the following actions Scan the QR code to install the App and get 2 free unlocks Unlock quizzes for free by uploading documents
![]()
![]()
![]()

