Figure 13-4B
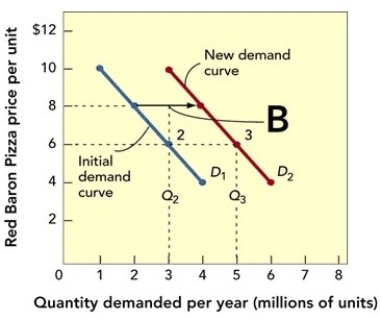
-A shift of the demand curve from D₂ to D₃ in Figure 13-4B above indicates
A) fewer units are demanded at the given price.
B) more units are demanded at the given price.
C) the price has decreased.
D) the price has increased.
E) there is not enough information given to indicate what happened.
Correct Answer:
Verified
Q125: All of the following are demand factors
Q126: The horizontal axis of a demand curve
Q128: Factors that determine consumers' willingness and ability
Q135: A demand curve is a graph that
Q138: Figure 13-3 Q141: Which of the following statements about the Q142: Figure 13-4B Q146: Price elasticity of demand (E)is expressed as Q147: Figure 13-4B Q148: While consumer tastes and price and availability Unlock this Answer For Free Now! View this answer and more for free by performing one of the following actions Scan the QR code to install the App and get 2 free unlocks Unlock quizzes for free by uploading documents
![]()
![]()
![]()

