Use the following diagram to answer the following questions.
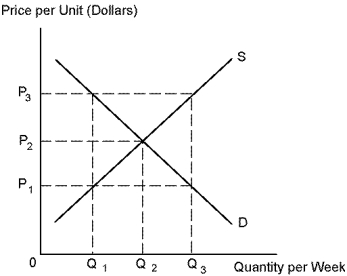
-Refer to Diagram 4-1. When price is P₁ the quantity demanded is:
A) Q₁.
B) Q₂.
C) Q3.
D) somewhere between Q₂ and Q3.
Correct Answer:
Verified
Q89: Use the following diagram to answer the
Q96: A decrease in the price of tractors
Q97: Suppose the price of Toyotas increases. This
Q99: Use the following diagram to answer the
Q100: Use the following diagram to answer the
Q101: Suppose there is an increase in the
Q102: Toyotas and Nissans are substitutes. Suppose there
Q103: Suppose the supply of soy beans increases
Q104: Use the following diagram to answer the
Q105: Bread and butter are complements. Suppose there
Unlock this Answer For Free Now!
View this answer and more for free by performing one of the following actions

Scan the QR code to install the App and get 2 free unlocks

Unlock quizzes for free by uploading documents