Multiple Choice
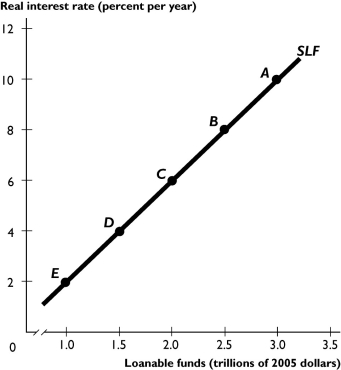
The figure above shows the supply of loanable funds curve.
-In the figure above, a movement from point A to point C can be the result of
A) a fall in expected future income.
B) an increase in disposable income.
C) a rise in the real interest rate.
D) a fall in the real interest rate.
E) an increase in wealth.
Correct Answer:
Verified
Related Questions
Q221: What does the Ricardo-Barro Effect predict?
A) The
Q222: What is the difference, if any, between

