Multiple Choice
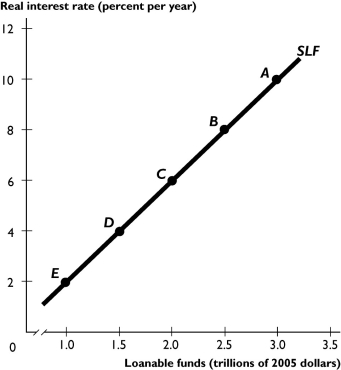
The figure above shows the supply of loanable funds curve.
-If saving supply decreases, the equilibrium real interest rate ________ and the equilibrium quantity of investment ________.
A) rises; increases
B) rises; decreases
C) falls; increases
D) falls; decreases
E) does not change; does not change
Correct Answer:
Verified
Related Questions
Q218: The Ricardo-Barro effect refers to how _
Q219: Suppose the government has a budget deficit
Q220: The Ricardo-Barro effect argues that the crowding-out
Q221: What does the Ricardo-Barro Effect predict?
A) The
Q222: What is the difference, if any, between

