20.3 Chapter Figures
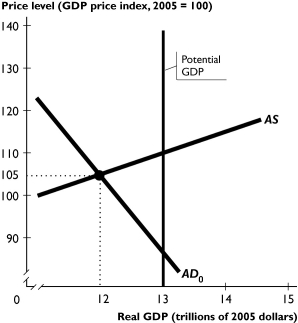
The figure above shows a nation's aggregate demand curve, aggregate supply curve, and potential GDP.
-In the figure above, to use fiscal policy to move the economy back to potential GDP, the government must increase government expenditure by ________ $1 trillion and/or decrease taxes by ________ $1 trillion.
A) recessionary; exactly; exactly
B) inflationary; less than; less than
C) recessionary; less than; more than
D) recessionary; less than; less than
E) recessionary; more than; more than
Correct Answer:
Verified
Q144: When the economy is in a recession,the
Q162: When the economy is in a recession,_
Q163: Do automatic fiscal stabilizers eliminate business cycles?
A)Yes
B)No,because
Q170: Q171: Raising the federal funds rate shifts the Q173: The Fed raises the federal funds rate Q174: Government tax revenues _ during an expansion Q178: If the Fed sells government securities,other interest Q179: One problem with the ripple effect from Q180: ![]()
![]()
Unlock this Answer For Free Now!
View this answer and more for free by performing one of the following actions

Scan the QR code to install the App and get 2 free unlocks

Unlock quizzes for free by uploading documents