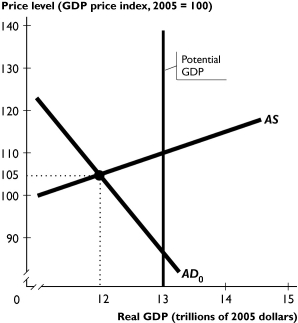
 The figure above shows a nation's aggregate demand curve,aggregate supply curve,and potential GDP.
-In the figure above,the ________ gap is one trillion dollars.To close the gap,the government can ________ government expenditure and/or ________ taxes.
A) recessionary;increase;decrease
B) inflationary;decrease;increase
C) inflationary;increase;increase
D) recessionary;decrease;decrease
E) recessionary;decrease;increase
Correct Answer:
Verified
Q175: An advantage monetary policy has over fiscal
Q176: Q177: The FOMC is the Q178: If the Fed sells government securities,other interest Q179: One problem with the ripple effect from Q181: Depending on the relative size of the Q182: Explain the difference between discretionary and automatic Q184: A country reports that its government outlays Q230: Ignoring any supply-side effects, how does the Q281: Define the balanced budget multiplier and explain![]()
A)report the Fed gives
Unlock this Answer For Free Now!
View this answer and more for free by performing one of the following actions

Scan the QR code to install the App and get 2 free unlocks

Unlock quizzes for free by uploading documents