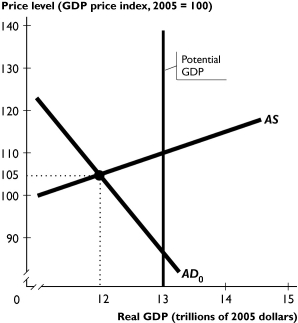
 The figure above shows a nation's aggregate demand curve,aggregate supply curve,and potential GDP.
-In the figure above,the ________ gap is equal to ________.
A) recessionary;$1 trillion
B) inflationary;$1 trillion
C) recessionary;$12 trillion
D) inflationary;$12 trillion
E) recessionary;$13 trillion
Correct Answer:
Verified
Q144: When the economy is in a recession,the
Q171: Raising the federal funds rate shifts the
Q173: The Fed raises the federal funds rate
Q174: Government tax revenues _ during an expansion
Q175: An advantage monetary policy has over fiscal
Q177: The FOMC is the
A)report the Fed gives
Q178: If the Fed sells government securities,other interest
Q179: One problem with the ripple effect from
Unlock this Answer For Free Now!
View this answer and more for free by performing one of the following actions

Scan the QR code to install the App and get 2 free unlocks

Unlock quizzes for free by uploading documents