Multiple Choice
Exhibit 1A-4
a.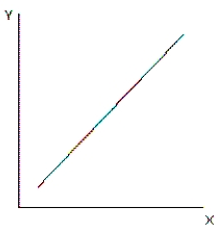
b.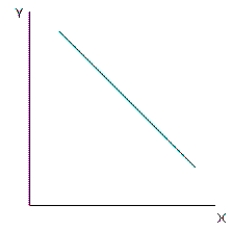
c. 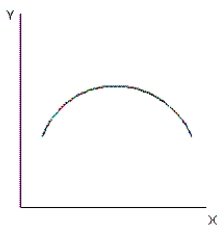 d.
d.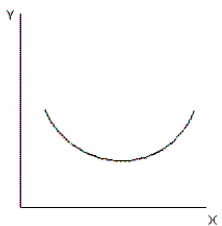
-Refer to the exhibit.Which graph illustrates a relationship between variable X and variable Y that begins positively but then changes to a negative relationship?
A) graph a
B) graph b
C) graph c
D) graph d
Correct Answer:
Verified
Related Questions
Q9: Exhibit 1A-3 Q10: Exhibit 1A-4 Q11: Exhibit 1A-2 Q12: What can be assumed if a given
![]()
a.![]()
![]()

