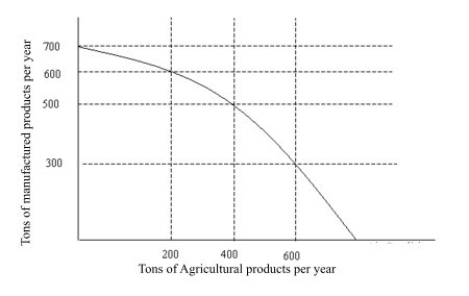
Solved

Figure 2.1 -On the Production Possibilities Curve in Figure 2.1,as Agricultural Production

Question 25

Multiple Choice

   Figure 2.1 -On the production possibilities curve in Figure 2.1,as agricultural production increases by 200 tons per year from 200 tons to 400 tons and then to 600 tons,the opportunity cost in terms of tons of manufactured goods A)  rises. B)  falls. C)  is constant. D)  becomes negative.
Figure 2.1
-On the production possibilities curve in Figure 2.1,as agricultural production increases by 200 tons per year from 200 tons to 400 tons and then to 600 tons,the opportunity cost in terms of tons of manufactured goods


A) rises.
B) falls.
C) is constant.
D) becomes negative.

Correct Answer:

verifed

Verified

Unlock this answer now
Get Access to more Verified Answers free of charge

Related Questions

Unlock this Answer For Free Now!

View this answer and more for free by performing one of the following actions

qr-code

Scan the QR code to install the App and get 2 free unlocks

upload documents

Unlock quizzes for free by uploading documents