Multiple Choice
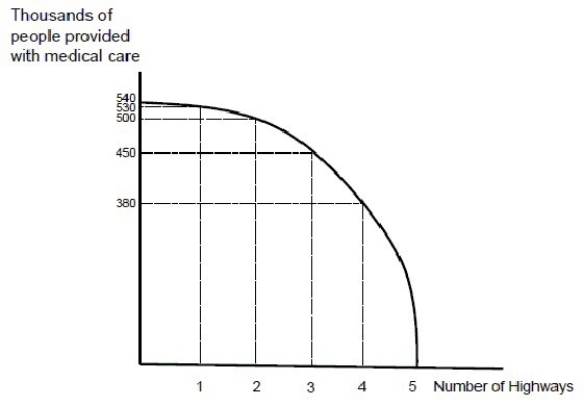
Figure 2.2
-Figure 2.2 presents a production possibilities curve for a given year for a country that can either produce highways or provide people with medical care.The figure shows that as more highways are built,the opportunity cost of building each additional highway is
A) decreasing.
B) increasing.
C) constant.
D) decreasing and then increasing.
Correct Answer:
Verified
Related Questions

