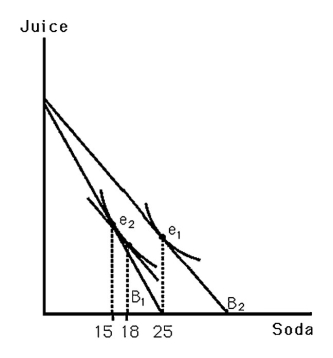
-The above figure shows Bobby's indifference map for soda and juice.B1 indicates his original budget line.B2 indicates his budget line resulting from an increase in the price of soda.From the graph,one can conclude that
A) Bobby views soda as an inferior good.
B) Bobby's demand for soda is perfectly inelastic.
C) Bobby views soda as a normal good.
D) the income elasticity of demand for soda is one.
Correct Answer:
Verified
Q41: When the price of a good changes,the
Q43: The substitution effect can be measured holding
Q46: In the case of a normal good,
A)
Q51: One characteristic of a Giffen good is
Q52: Suppose that frozen dinners were once a
Q58: Median household income is $50,000 per year.The
Q61: To separate the income and substitute effects,the
Unlock this Answer For Free Now!
View this answer and more for free by performing one of the following actions

Scan the QR code to install the App and get 2 free unlocks

Unlock quizzes for free by uploading documents