Refer to the following graph to answer the questions that follow.
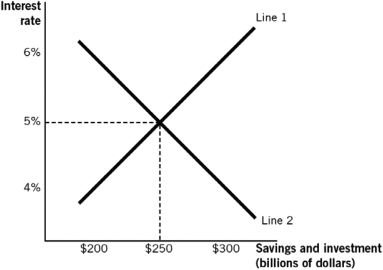
-In the figure,at an interest rate of 6%,the:
A) quantity demanded of loanable funds equals the quantity supplied of loanable funds, and equilibrium is reached.
B) quantity demanded of loanable funds is greater than the quantity supplied of loanable funds, and there is a surplus of loanable funds.
C) demand for loanable funds is greater than the supply of loanable funds, and there is a shortage of loanable funds.
D) quantity demanded of loanable funds is greater than the quantity supplied of loanable funds, and there is a shortage of loanable funds.
E) quantity demanded of loanable funds is less than the quantity supplied of loanable funds, and there is a surplus of loanable funds.
Correct Answer:
Verified
Q2: The interest rate is
A) the price of
Q9: The concept of the loanable funds market
Q14: Borrowers in the loanable funds market consist
Q20: Lenders in the loanable funds market consist
Q22: If interest rates fell between 1981 and
Q24: Gross domestic product requires
A) inflation equal to
Q26: The government engages in more deficit spending.Ceteris
Q35: An interest rate best represents _ to
Q61: Refer to the following graph to answer
Q66: Refer to the following graph to answer
Unlock this Answer For Free Now!
View this answer and more for free by performing one of the following actions

Scan the QR code to install the App and get 2 free unlocks

Unlock quizzes for free by uploading documents