Refer to the following graph to answer the questions that follow.
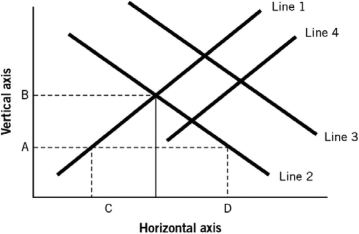
-Assuming the figure represents the market for loanable funds,which of the following would represent an increase in household income?
A) a shift from line 1 to line 4
B) a shift from line 4 to line 1
C) a shift from line 2 to line 3
D) movement from A to B
E) a new shortage of loanable funds represented by the distance from C to D
Correct Answer:
Verified
Q22: If interest rates fell between 1981 and
Q26: The government engages in more deficit spending.Ceteris
Q27: You are an entrepreneur about to start
Q28: By 2014:
A) most interest rates were about
Q34: Smiley Myrus owns a large corporation that
Q35: An interest rate best represents _ to
Q48: If the federal government taxes the interest
Q52: If interest rates rise,
A) foreign entities that
Q61: Refer to the following graph to answer
Q66: Refer to the following graph to answer
Unlock this Answer For Free Now!
View this answer and more for free by performing one of the following actions

Scan the QR code to install the App and get 2 free unlocks

Unlock quizzes for free by uploading documents