Multiple Choice
Figure 10.3.1 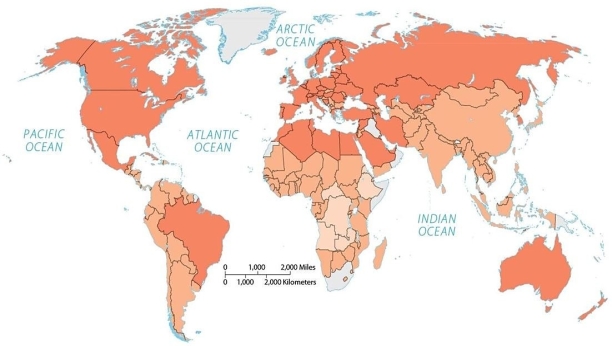
-If darker shades represent higher values,this is most likely a map of
A) dietary energy consumption.
B) percent of income spent on food.
C) percent undernourished.
D) change in number undernourished.
E) per capita fish consumption.
Correct Answer:
Verified
Related Questions
Q14: Food consumption varies around the world because
Q15: Undernourishment is most severe in _ where
Q16: Residents of developed countries rely on _
Q17: Developing countries obtain most of their protein
Unlock this Answer For Free Now!
View this answer and more for free by performing one of the following actions

Scan the QR code to install the App and get 2 free unlocks

Unlock quizzes for free by uploading documents