What would you infer from the following graph?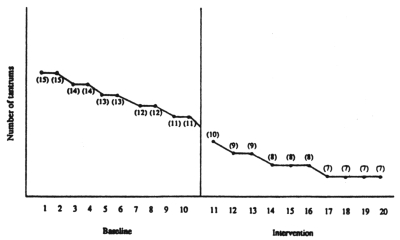
A) The intervention appears to be effective.
B) Maturation appears to be the most plausible explanation.
C) History appears to be the most plausible explanation.
D) Regression toward the mean appears to be the most plausible explanation.
Correct Answer:
Verified
Q2: Target problems can be quantified in terms
Q4: The length of the baseline in single-case
Q6: In single-case experiments, increasing the number of
Q7: In single-case experiments, direct observation is always
Q11: In a single-case design with a student
Q11: Suppose an ABCD design obtains the following
Q16: Most social work target problems or goals
Q20: For most clinical social work situations there
Q25: A practitioner conducts a single-case evaluation to
Q27: A practitioner tests whether a new technique
Unlock this Answer For Free Now!
View this answer and more for free by performing one of the following actions

Scan the QR code to install the App and get 2 free unlocks

Unlock quizzes for free by uploading documents