Exhibit 3-11 Demand and supply curves
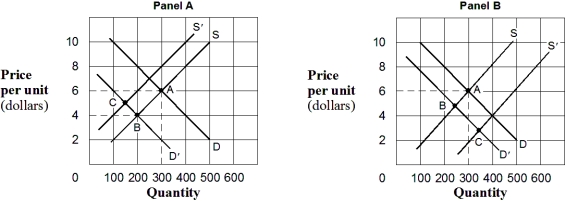
-In Exhibit 3-11,in Panel A the movement from A to C describes a(n) :
A) ambiguous change in price and a decrease in quantity.
B) increase in price and an ambiguous change in quantity.
C) increase in both price and quantity.
D) decrease in both price and quantity.
E) change in supply that dominates a change in demand.
Correct Answer:
Verified
Q57: Exhibit 3-11 Demand and supply curves
Q142: Q265: Exhibit 3-10 Demand and supply curves Q286: Exhibit 3-15 Supply and demand curves for Q290: Exhibit 3-12 Supply and demand data Q293: Exhibit 3-15 Supply and demand curves for Q305: If pork and beans is an inferior Q307: Demand curves slope downward to the right. Q317: Suppose A and B are complementary goods. Q320: If the price of good X increases![]()
Unlock this Answer For Free Now!
View this answer and more for free by performing one of the following actions

Scan the QR code to install the App and get 2 free unlocks

Unlock quizzes for free by uploading documents