Exhibit 4-4 Supply and demand curves for good X
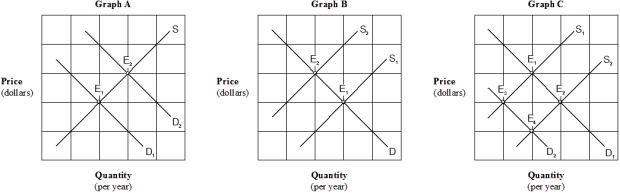
-Which of the graphs in Exhibit 4-4 illustrates an increase in buyers' income,assuming that good X is a normal good?
A) Graph A.
B) Graph B.
C) Graph C.
D) None of the above.
Correct Answer:
Verified
Q21: Suppose prices for new homes have risen,
Q29: Which of the following would raise both
Q33: Consider the market for chicken. Assuming that
Q47: Exhibit 4-4 Supply and demand curves for
Q48: Which of the following statements is true
Q49: Exhibit 4-4 Supply and demand curves for
Q54: Exhibit 4-3 Supply and demand curves
Q55: If the cost of fertilizer rises, then
Q56: Exhibit 4-6 Demand and supply curves
Q67: An increase in consumers' incomes will have
Unlock this Answer For Free Now!
View this answer and more for free by performing one of the following actions

Scan the QR code to install the App and get 2 free unlocks

Unlock quizzes for free by uploading documents