Exhibit 4-4 Supply and demand curves for good X
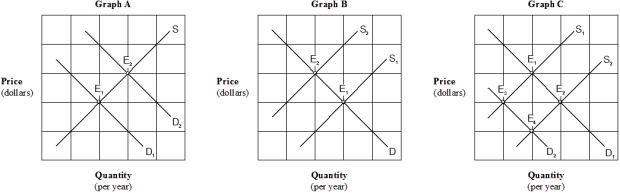
-An increase in the wage rate paid to workers producing good X would be represented by which of the graphs in Exhibit 4-4?
A) Graph A.
B) Graph B.
C) Graph C.
D) None of the above.
Correct Answer:
Verified
Q21: Suppose prices for new homes have risen,
Q29: Which of the following would raise both
Q42: Exhibit 4-4 Supply and demand curves for
Q43: Exhibit 4-4 Supply and demand curves for
Q44: Exhibit 4-3 Supply and demand curves
Q45: Exhibit 4-4 Supply and demand curves for
Q48: Which of the following statements is true
Q49: Exhibit 4-4 Supply and demand curves for
Q51: Exhibit 4-4 Supply and demand curves for
Q55: If the cost of fertilizer rises, then
Unlock this Answer For Free Now!
View this answer and more for free by performing one of the following actions

Scan the QR code to install the App and get 2 free unlocks

Unlock quizzes for free by uploading documents