Exhibit 4-4 Supply and demand curves for good X
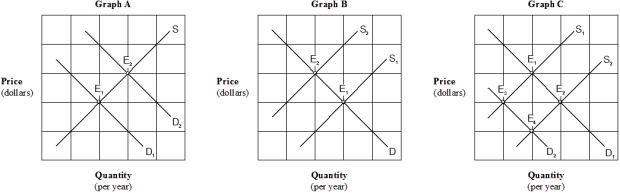
-An increase in the price of a complementary good would be represented in which of the graphs in Exhibit 4-4?
A) Graph A.
B) Graph B.
C) Graph C.
D) None of the above.
Correct Answer:
Verified
Q37: Exhibit 4-2 Supply and demand curves
Q39: Exhibit 4-2 Supply and demand curves
Q40: Exhibit 4-3 Supply and demand curves
Q43: Exhibit 4-4 Supply and demand curves for
Q44: Exhibit 4-3 Supply and demand curves
Q45: Exhibit 4-4 Supply and demand curves for
Q47: Exhibit 4-4 Supply and demand curves for
Q55: If the cost of fertilizer rises, then
Q76: If market supply decreases and, simultaneously, market
Q175: Consider the market for grapes. An increase
Unlock this Answer For Free Now!
View this answer and more for free by performing one of the following actions

Scan the QR code to install the App and get 2 free unlocks

Unlock quizzes for free by uploading documents