Figure 8-5
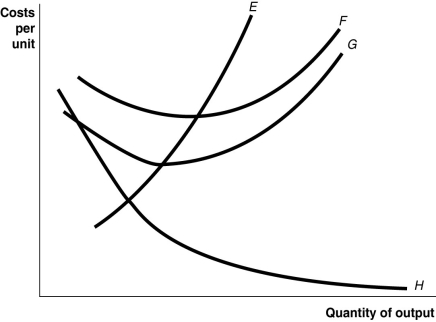
-Refer to Figure 8-5.Identify the curves in the diagram.
A) E = average fixed cost curve; F = variable cost curve; G = total cost curve, H = marginal cost curve
B) E = marginal cost curve; F = total cost curve; G = variable cost curve, H = average fixed cost curve
C) E = average fixed cost curve; F = average total cost curve; G = average variable cost curve, H = marginal cost curve
D) E = marginal cost curve; F = average total cost curve; G = average variable cost curve; H = average fixed cost curve
Correct Answer:
Verified
Q164: In the short run, if average product
Q171: If average total cost is falling, marginal
Q177: Figure 8-4 Q180: If the total cost of producing 20 Q181: Figure 8-6 Q183: Figure 8-5 Q184: Figure 8-5 Q184: Which of the following statements is false? Q185: Table 8-7 Q194: Average fixed cost is equal to Unlock this Answer For Free Now! View this answer and more for free by performing one of the following actions Scan the QR code to install the App and get 2 free unlocks Unlock quizzes for free by uploading documents
![]()
![]()
![]()
![]()
A)When
A)the amount

