Multiple Choice
Figure 8-5
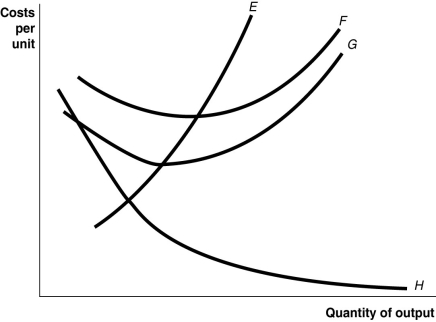
-Refer to Figure 8-5.The vertical difference between curves F and G measures
A) average fixed costs.
B) marginal costs.
C) fixed costs.
D) sunk costs.
Correct Answer:
Verified
Related Questions
Q79: If the average variable cost curve is
Q171: If average total cost is falling, marginal
Q180: If the total cost of producing 20
Q181: Figure 8-6
![]()

