The two figures below represent an asexual and a sexual population,respectively.The letters indicate beneficial mutations.The shaded areas represent the frequency of particular combinations of mutations in the population over time.Why does it take longer for the beneficial allele combination of ABC to go to fixation in the asexual population than in the sexual population? 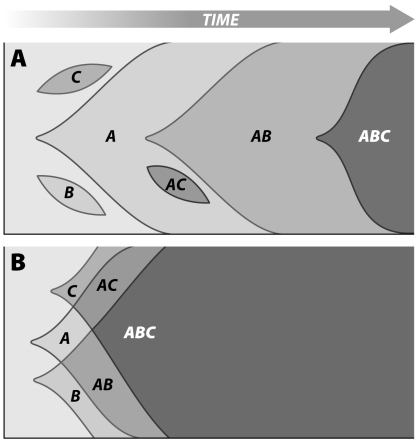
A) In the asexual population, new allelic combinations have to arise via de novo mutations.
B) There is no principal difference between asexual and sexual populations. In the sexual population shown, the favorable mutations just happen to be on different chromosomes.
C) The effective population size of both populations is the same.
D) Sexual populations tend to have higher mutation rates.
Correct Answer:
Verified
Q8: Why is sexual reproduction believed to be
Q9: What is the consequence of a deleterious
Q10: Which of the following statements illustrates a
Q11: Some mammals have demonstrated preferential attraction to
Q13: According to the reasoning of Maynard Smith,the
Q15: In an experiment,Jokela and colleagues reared 14
Q16: What are coadapted gene complexes?
A)Genes that are
Q17: Which of the following statements describes an
Q18: Would there be any disadvantage of sex
Q19: Which of the following systems lends itself
Unlock this Answer For Free Now!
View this answer and more for free by performing one of the following actions

Scan the QR code to install the App and get 2 free unlocks

Unlock quizzes for free by uploading documents