The figure given below represents a perfectly competitive market in long-run equilibrium.LRS represents the long-run supply curve of this market with demand (D) and price $50.When two large firms merge, output declines to 400 units and per unit production cost drops to $30.
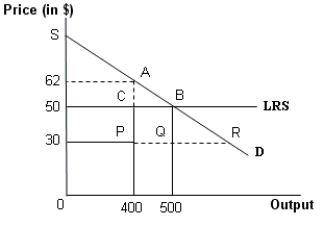
-Refer to Figure .Which of the following regions in the figure represents the deadweight loss resulting from the merger?
A) Area of triangle APR
B) Area of the square BCPQ
C) Area of the triangle BQR
D) Area of triangle ACB
Correct Answer:
Verified
Q51: The figure given below represents a monopoly
Q52: In order to be successful as an
Q53: The figure given below represents a monopoly
Q54: The figure given below represents a monopoly
Q55: Which of the following factors affect vertical
Q57: Which of the following activities undertaken by
Q58: The figure given below represents a perfectly
Q59: Which of the following is true about
Q60: The figure given below represents a perfectly
Q61: Name some of the barriers to entry
Unlock this Answer For Free Now!
View this answer and more for free by performing one of the following actions

Scan the QR code to install the App and get 2 free unlocks

Unlock quizzes for free by uploading documents