In the pie chart below, the proportion of nitrogen in the atmosphere is labeled: 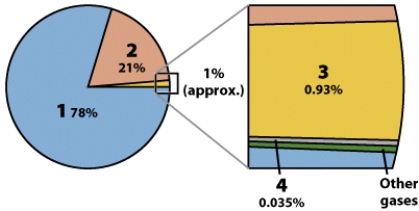
A) 1
B) 2
C) 3
D) 4
Correct Answer:
Verified
Q65: Which of these figures best illustrates the
Q66: In the pie chart below, the proportion
Q67: On this figure, the subtropical zones are
Q68: On this figure, the subarctic zones are
Q69: Which of the numbered sections on this
Q71: In the pie chart below, the proportion
Q72: In the pie chart above, the proportion
Q73: Which of the numbered sections on this
Q74: Which of the daily solar paths shown
Q75: On this figure, the mid-latitude zones are
Unlock this Answer For Free Now!
View this answer and more for free by performing one of the following actions

Scan the QR code to install the App and get 2 free unlocks

Unlock quizzes for free by uploading documents