In the pie chart below, the proportion of oxygen in the atmosphere is labeled: 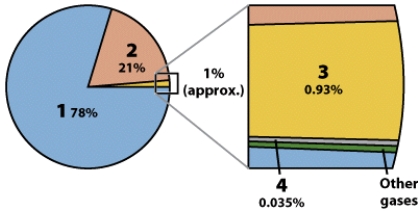
A) 1
B) 2
C) 3
D) 4
Correct Answer:
Verified
Q61: Which of the numbered sections on this
Q62: Which of these figures best illustrates the
Q63: The Earth's annual net radiation budget is:
A)positive
Q64: Which of the numbered sections on this
Q65: Which of these figures best illustrates the
Q67: On this figure, the subtropical zones are
Q68: On this figure, the subarctic zones are
Q69: Which of the numbered sections on this
Q70: In the pie chart below, the proportion
Q71: In the pie chart below, the proportion
Unlock this Answer For Free Now!
View this answer and more for free by performing one of the following actions

Scan the QR code to install the App and get 2 free unlocks

Unlock quizzes for free by uploading documents