The graph that best depicts the seasonal variability in precipitation found in the tropical desert precipitation regime is number ____. 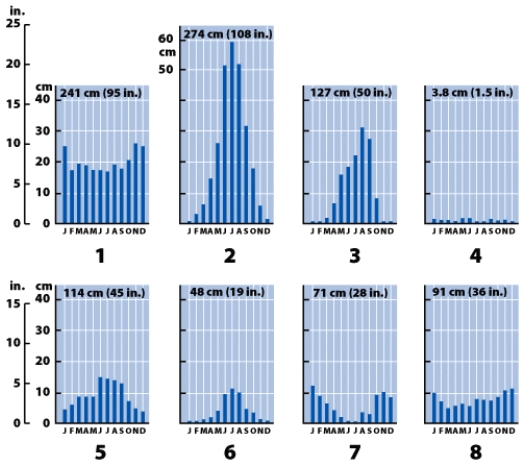
A) 1
B) 2
C) 3
D) 4
Correct Answer:
Verified
Q72: In the United States, the moist continental
Q73: The graph that best depicts the seasonal
Q74: The graph that best depicts the seasonal
Q75: The air mass source region labeled 3
Q76: The precipitation pattern of the moist continental
Q78: The graph that best depicts the seasonal
Q79: The temperature pattern found in the moist
Q80: The major air mass(es)that influence the high-latitude
Q81: Latitude is an important factor affecting climate.
Q82: Climate can be described as the average
Unlock this Answer For Free Now!
View this answer and more for free by performing one of the following actions

Scan the QR code to install the App and get 2 free unlocks

Unlock quizzes for free by uploading documents