The graph that best depicts the seasonal variability in precipitation found in the moist subtropical precipitation regime is number ____. 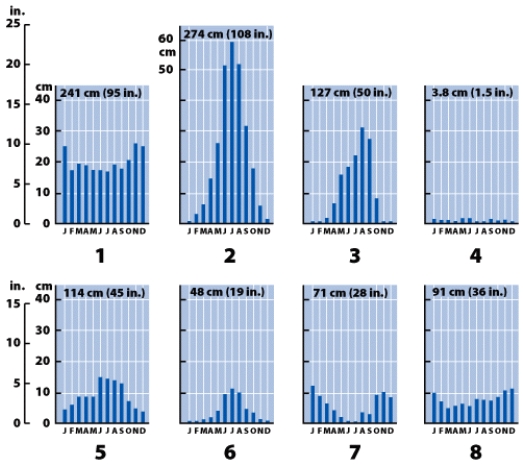
A) 5
B) 6
C) 7
D) 8
Correct Answer:
Verified
Q73: The graph that best depicts the seasonal
Q74: The graph that best depicts the seasonal
Q75: The air mass source region labeled 3
Q76: The precipitation pattern of the moist continental
Q77: The graph that best depicts the seasonal
Q79: The temperature pattern found in the moist
Q80: The major air mass(es)that influence the high-latitude
Q81: Latitude is an important factor affecting climate.
Q82: Climate can be described as the average
Q83: On this map, the region(s)labeled 6 (in
Unlock this Answer For Free Now!
View this answer and more for free by performing one of the following actions

Scan the QR code to install the App and get 2 free unlocks

Unlock quizzes for free by uploading documents