The graph shown indicates the incidence of whooping cough in the United States.What information can you determine from this graph?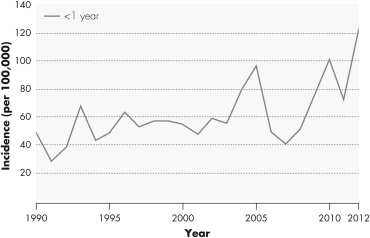
A) Approximately 40,000 individuals were infected with whooping cough in 2007.
B) The incidence of whooping cough in infants under one year of age in 2013 was higher than the incidence in 2012.
C) Vaccination against whooping cough has become less effective in infants under the age of one year over time.
D) The incidence of whooping cough declined dramatically between 2005 and 2007.
Correct Answer:
Verified
Q16: Which of the following infections would affect
Q17: The most likely mutation to cause an
Q18: Nicotine in cigarette smoke paralyzes the cilia
Q19: What is the significance of the anatomical
Q20: The structure indicated on this figure is
Q22: Acute otitis media is infection within the
A)
Q23: The graph shown indicates the incidence of
Q24: Which of the following organisms is an
Q25: This figure shows the relative incidence of
Q26: Close contact with respiratory droplets from which
Unlock this Answer For Free Now!
View this answer and more for free by performing one of the following actions

Scan the QR code to install the App and get 2 free unlocks

Unlock quizzes for free by uploading documents