The graph shown indicates the incidence of whooping cough in the United States.What information can you determine from this graph?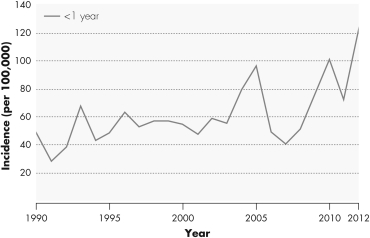
A) There was a decline in vaccination rates of infants under one year of age during the early 1990s.
B) The incidence of whooping cough in infants under one year of age was declining prior to 1990.
C) Waning immunity in adult populations has led to an increase in whooping cough.
D) The incidence of whooping cough in infants under one year of age was higher in 2010 than it was in 1995.
Correct Answer:
Verified
Q18: Nicotine in cigarette smoke paralyzes the cilia
Q19: What is the significance of the anatomical
Q20: The structure indicated on this figure is
Q21: The graph shown indicates the incidence of
Q22: Acute otitis media is infection within the
A)
Q24: Which of the following organisms is an
Q25: This figure shows the relative incidence of
Q26: Close contact with respiratory droplets from which
Q27: A day-care worker reports that two young
Q28: A young man who enjoys spelunking,the recreational
Unlock this Answer For Free Now!
View this answer and more for free by performing one of the following actions

Scan the QR code to install the App and get 2 free unlocks

Unlock quizzes for free by uploading documents