The graph shows the variation in radiation intensity per unit wavelength versus wavelength for a perfect blackbody at temperature T. 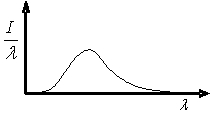 Complete the following statement: As the blackbody temperature is increased,the peak in intensity of this curve
A) will remain constant.
B) will be shifted to longer wavelengths and its magnitude will increase.
C) will be shifted to shorter wavelengths and its magnitude will increase.
D) will be shifted to longer wavelengths and its magnitude will decrease.
E) will be shifted to shorter wavelengths and its magnitude will decrease.
Correct Answer:
Verified
Q1: When ultraviolet photons with a wavelength of
Q3: A laser produces 3.0 W of light
Q4: Complete the following statement: The photon description
Q5: White light consisting of wavelengths 380 nm
Q6: Which one of the following quantities is
Q7: For which one of the following problems
Q8: Electrons are emitted from a certain metal
Q9: Determine the energy of a single photon
Q10: An X-ray generator produces photons with energy
Q11: Which type of wave motion does not
Unlock this Answer For Free Now!
View this answer and more for free by performing one of the following actions

Scan the QR code to install the App and get 2 free unlocks

Unlock quizzes for free by uploading documents