3.4 Market Effects of Changes in Demand
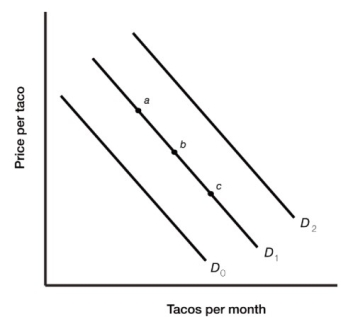 Figure 3.3
-Figure 3.3 illustrates the demand for tacos. An increase in the demand for tacos is represented by the movement from
A) point a to point b.
B) point c to point b.
C) D₂ to D₁.
D) D₀ to D₁.
Correct Answer:
Verified
Q62: 3.4 Market Effects of Changes in Demand
Q62: Governments sometime create an excess supply of
Q64: 3.4 Market Effects of Changes in Demand
Q66: 3.4 Market Effects of Changes in Demand
Q69: 3.4 Market Effects of Changes in Demand
Q72: 3.4 Market Effects of Changes in Demand
Q74: Landon demands more sushi as his income
Q78: When the price of apples goes up
A)
Q128: Suppose that consumers expect that the price
Q137: Suppose that a product benefits from a
Unlock this Answer For Free Now!
View this answer and more for free by performing one of the following actions

Scan the QR code to install the App and get 2 free unlocks

Unlock quizzes for free by uploading documents