3.4 Market Effects of Changes in Demand
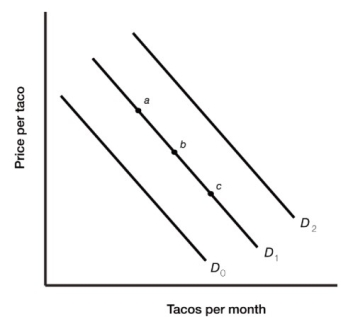 Figure 3.3
-Figure 3.3 illustrates the demand for tacos. A decrease in the demand for tacos is represented by the movement from
A) point a to point b.
B) point c to point b.
C) D₂ to D₁.
D) D₀ to D₁.
Correct Answer:
Verified
Q62: Governments sometime create an excess supply of
Q64: 3.4 Market Effects of Changes in Demand
Q66: 3.4 Market Effects of Changes in Demand
Q67: 3.4 Market Effects of Changes in Demand
Q72: 3.4 Market Effects of Changes in Demand
Q72: Assume that coffee and tea are substitutes.
Q74: Landon demands more sushi as his income
Q128: Suppose that consumers expect that the price
Q137: Suppose that a product benefits from a
Q153: Assume that tortilla chips and salsa are
Unlock this Answer For Free Now!
View this answer and more for free by performing one of the following actions

Scan the QR code to install the App and get 2 free unlocks

Unlock quizzes for free by uploading documents