Multiple Choice
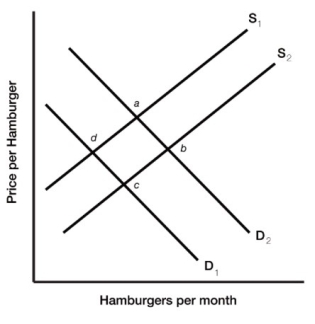 Figure 3.5
-Figure 3.5 illustrates a set of supply and demand curves for hamburgers. An increase in supply and an increase in quantity demanded are represented by a movement from
A) point a to point b.
B) point a to point c.
C) point d to point b.
D) point c to point d.
Correct Answer:
Verified
Related Questions
Q103: An increase in supply of a product
Q106: The price of pineapples has risen dramatically.
Q115: A decrease in demand will cause the
Q116: 3.5 Market Effects of Changes in Supply
Q119: Describe the changes in the variables that
Unlock this Answer For Free Now!
View this answer and more for free by performing one of the following actions

Scan the QR code to install the App and get 2 free unlocks

Unlock quizzes for free by uploading documents