 Figure 6.5
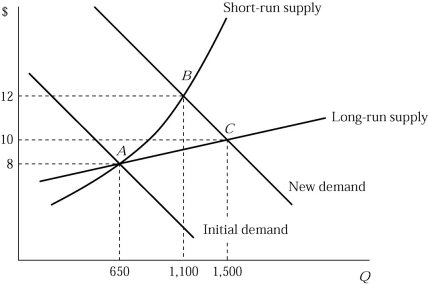
-Figure 6.5 shows the short-run and long-run effects of an increase in demand of an industry. The market is in equilibrium at point A, where 100 identical firms produce 6 units of a product per hour. If the market demand curve shifts to the right, what will happen to the number of firms in the industry as the industry moves from point A to point B?
A) It increases.
B) It decreases.
C) It remains the same.
D) either A or B or C
Correct Answer:
Verified
Q189: Recall the Application about the price and
Q190: It is possible that a firm in
Q191: An increase in demand will lead to
Q192: An increase in demand will induce entry
Q193: One difference between the short run and
Unlock this Answer For Free Now!
View this answer and more for free by performing one of the following actions

Scan the QR code to install the App and get 2 free unlocks

Unlock quizzes for free by uploading documents